Glycemic Index vs Glycemic Load for Metabolic Health Guide
Author: Feras Alayed
Published:
Category: insulin-resistance
Reading Time: 15 minutes
Key Takeaways
- The Glycemic Index (GI) provides a standardized measurement regarding the rate at which a specific carbohydrate converts to glucose, but it fundamentally omits the actual portion size consumed in a standard setting.
- The Glycemic Load (GL) incorporates a mathematical adjustment that combines the inherent digestion speed of the food with the actual physical quantity of carbohydrates present on the plate, offering a different perspective on meal composition.
- Everyday variables such as the application of heat during cooking, the botanical ripeness of fruits, and the strategic combination of foods with dietary fiber, complex proteins, and lipids completely modify the digestive timeline of a meal.
- Neither metric functions as a flawless standalone rule; rather, utilizing these concepts as organizational frameworks within a broader lifestyle approach facilitates informed daily decisions without necessitating strict culinary elimination.
TL;DR
When individuals begin to observe their metabolic parameters, they frequently encounter scientific terminology such as Glycemic Index and Glycemic Load. In observational terms, the Index provides a numerical value related to the inherent properties and digestive speed of carbohydrates, while the Load offers a combined metric that accounts for both those inherent properties and the physical volume of a real-world portion. Understanding the nuanced differences between glycemic index vs glycemic load for metabolic observation assists in transitioning away from the strict avoidance of specific botanical foods (such as watermelon or carrots). Instead, this knowledge facilitates the organization of balanced meals that correspond with steady energy availability throughout the daily routine.
The Daily Challenge of Choosing Carbohydrates
The daily routine of selecting and preparing food involves navigating a complex environment filled with countless options, marketing terminology, and nutritional labels. When individuals begin the process of organizing their dietary habits, they frequently encounter extensive terminology regarding carbohydrates and energy metabolism. Carbohydrates are often discussed in the context of daily energy fluctuations and satiety cues. As individuals attempt to categorize their culinary options, they may encounter extensive lists that divide items into strict categories based on assigned numerical values. The challenge many face is that attempting to memorize or strictly apply these numerical lists requires significant cognitive effort and constant calculation.
This organizational approach often results in the exclusion of various botanical foods, such as certain fruits and root vegetables, simply because a specific assigned number appears elevated on a chart. Previous attempts to organize daily meals using only a single metric often lead to organizational fatigue, primarily because isolated numbers do not account for the complex mechanical and chemical interactions that occur when consuming a complete, multi-component meal. The modern grocery store environment further complicates this process, presenting consumers with highly processed items that may display favorable numbers on one metric while lacking basic nutritional density.
In this comprehensive educational guide, the concepts of "Glycemic Index" and "Glycemic Load" are examined in detail. Rather than viewing these concepts as rigid dietary laws or restrictive parameters, they can be understood as flexible organizational tools. These tools provide a structural framework for categorizing carbohydrates, observing food properties, and making informed decisions that align with your daily nutritional framework and metabolic observation. By shifting the focus from strict restriction to structural organization, individuals can navigate their food choices with a clearer understanding of how different components interact within the digestive system.
What is Glycemic Index vs Glycemic Load?
To accurately observe how different foods interact with the body's digestive processes, it is necessary to establish clear definitions for the terminology utilized by nutritional researchers. The distinction between these two metrics forms the foundation of modern carbohydrate categorization.
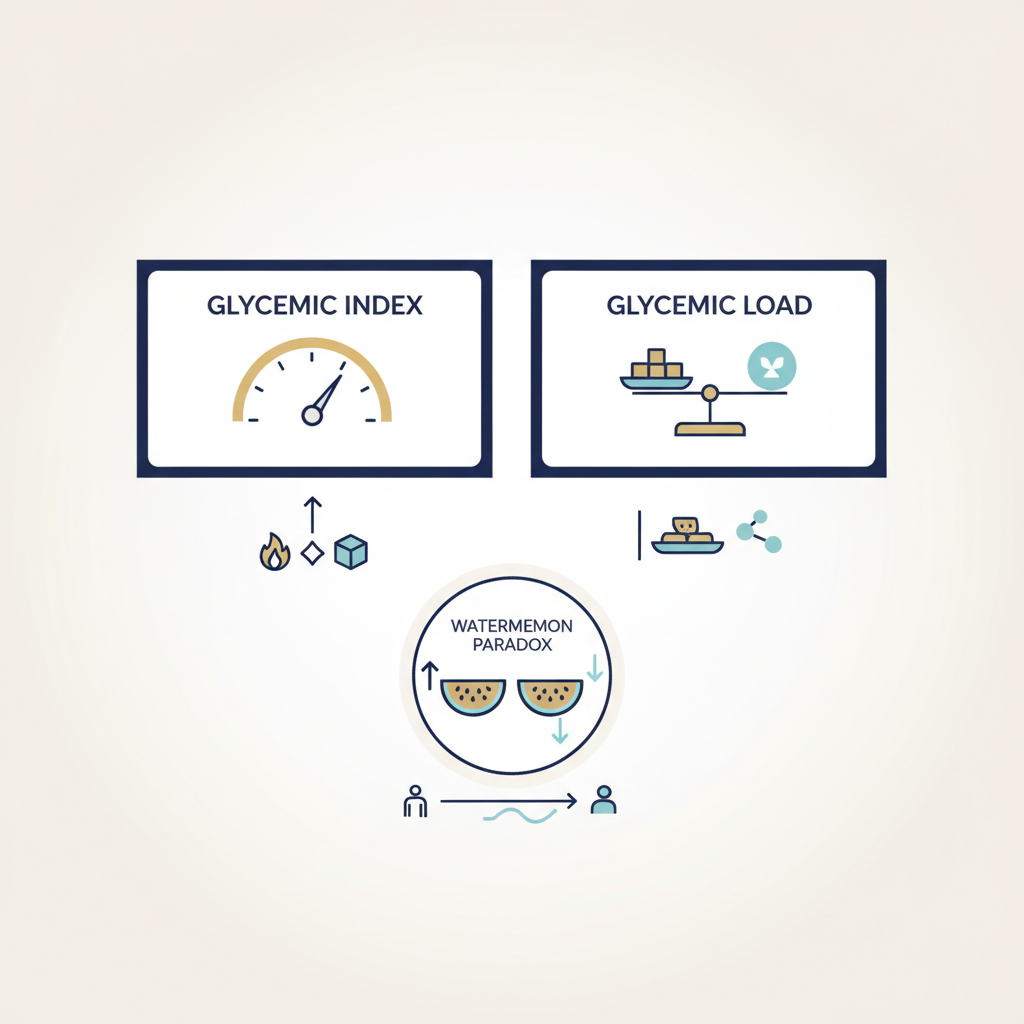
The Glycemic Index (GI) represents a standardized measurement scale ranging from 0 to 100. This scale categorizes carbohydrate-containing foods based on the observed rate at which they undergo enzymatic breakdown and convert to glucose in the bloodstream following ingestion. In observational settings, this measurement is typically determined by having individuals consume a specific portion of a single food item that contains exactly 50 grams of available carbohydrates. The subsequent blood glucose curve is then plotted and compared to a reference food, usually pure glucose or plain white bread, which is assigned a baseline value of 100. Foods that undergo rapid mechanical and chemical breakdown are assigned a higher GI value. Conversely, foods characterized by a slower rate of digestive processing receive a lower GI value. However, a primary characteristic of the GI metric is its reliance on that fixed 50-gram carbohydrate baseline. This standardized baseline does not inherently reflect the actual physical volume or quantity of the food an individual might consume during a standard meal setting.
The Glycemic Load (GL) introduces a mathematical adjustment to the Glycemic Index by incorporating the actual portion size consumed in a real-world scenario. This metric provides a combined assessment of both the rate of digestion (the GI) and the total carbohydrate mass present in a specific serving. The calculation for Glycemic Load involves multiplying the food's Glycemic Index by the number of carbohydrate grams in the consumed portion, and subsequently dividing that product by 100. The resulting figure offers a different perspective, focusing on the cumulative carbohydrate intake of a specific dietary choice rather than solely on the speed of absorption. By factoring in the physical volume and water content of the food, the GL presents a metric that aligns closely with everyday portion sizes and typical culinary habits. This mathematical relationship allows for a more contextual observation of meal composition.
Detailed Comparison Table: GI vs GL
Visual organization often assists in distinguishing between overlapping scientific concepts. To facilitate a clearer understanding of how to track and categorize food choices, the following table provides a detailed comparison between the two metrics across several observational criteria. When reviewing this table, consider how each metric applies to different stages of meal preparation, from grocery shopping to final plate assembly.
| Criteria | Glycemic Index (GI) | Glycemic Load (GL) |
|---|---|---|
| Primary Measurement | The observed rate of carbohydrate enzymatic breakdown and subsequent absorption. | The combined mathematical assessment of absorption rate and total carbohydrate mass. |
| Portion Size Consideration | Omits actual portion size; relies on a standardized 50-gram carbohydrate laboratory baseline. | Fundamentally incorporates the exact physical volume and weight of the consumed portion. |
| Calculation Complexity | Functions as a static assigned value for each specific food item. | Requires the application of a mathematical formula (GI x Carbs / 100) or digital tracking tools. |
| Real-World Application | Can present observational paradoxes (e.g., assigning a high value to water-dense fruits). | Provides a metric that corresponds more closely to standard culinary servings. |
| Focus of Observation | Exclusively evaluates the inherent structural properties of the carbohydrate. | Evaluates the structural properties in conjunction with the physical quantity. |
| Practical Utility | Serves as a quick heuristic tool for comparing two similar items gram-for-gram. | Serves as an analytical tool for evaluating the composition of an entire meal. |
| Categorization Scale | Low (0-55), Medium (56-69), High (70+). | Low (0-10), Medium (11-19), High (20+). |
By cross-referencing the columns in this table, individuals can observe that while the Index provides foundational data regarding food properties, the Load translates that data into a format that corresponds with actual eating habits. Both metrics possess distinct utility depending on the specific organizational goal of the user.
Strengths and Limitations of Each Approach
Every organizational tool possesses specific applications and inherent boundaries within a nutritional framework. Understanding the specific strengths and limitations of these metrics addresses the over-reliance on a single numerical value and encourages a more comprehensive observation of dietary habits.
Strengths of the Glycemic Index: The primary advantage of the GI lies in its heuristic simplicity. For individuals beginning to observe their food choices, it provides a straightforward method for comparing similar items. If an individual is attempting to select between a highly milled white bread and a structurally intact whole-grain bread, the GI immediately indicates which item possesses a slower rate of enzymatic breakdown. This metric generally directs attention toward foods that retain their natural structural integrity and away from items that have undergone extensive mechanical processing.
Limitations of the Glycemic Index: The most significant limitation of the GI is its omission of broader nutritional context. Because it solely measures carbohydrate absorption, it does not account for other macronutrients. For example, a food item rich in dietary fats, such as certain commercial snack foods, may present a lower GI value than a baked potato because the lipid content alters the digestive timeline. However, this lower numerical value does not inherently indicate a superior nutritional profile. Furthermore, the GI's reliance on a 50-gram carbohydrate baseline means that foods with high water content, which require large physical volumes to reach that 50-gram threshold, are often assigned disproportionately high values.
Strengths of the Glycemic Load: The GL addresses the primary limitation of the GI by contextualizing the food within a realistic portion. It mathematically accounts for the water and fiber volume present in a standard serving. This metric allows for greater dietary inclusivity, demonstrating that foods with a high GI can still result in a low GL if the consumed portion contains a minimal total mass of carbohydrates. This mathematical relationship accompanies balance and flexibility, allowing individuals to incorporate a wider variety of botanical foods into their routine without relying on strict elimination lists.
Limitations of the Glycemic Load: The application of the GL requires a higher degree of initial effort and calculation. Individuals must possess knowledge of the exact carbohydrate content of their food and accurately measure their portion sizes to utilize the formula effectively. This requirement for mathematical calculation or reliance on digital tracking applications can result in organizational fatigue for individuals who prefer qualitative guidelines over quantitative data analysis.
Hidden Factors That Alter Your Body's Response
Numerical values assigned to foods are not static properties. A variety of everyday variables and physical alterations modify the structural integrity of carbohydrates, thereby altering the resulting GI and GL values. Observing these factors reinforces the concept that these metrics function as flexible guiding tools rather than immutable laws.
1. Botanical Ripeness: As fruits undergo the natural maturation process, their internal chemical composition shifts. For example, a green banana contains a high proportion of complex starches. As the fruit ripens and develops spots, specialized enzymes convert these complex starches into simpler sugar molecules. This botanical transition alters the physical properties of the fruit, resulting in a higher numerical value on the index compared to its unripened state.
2. Mechanical Processing and Milling: The physical structure of a grain dictates its digestive timeline. When intact grains are mechanically milled into fine flour, the surface area of the carbohydrate is exponentially increased. This expanded surface area provides digestive enzymes with greater access to the starches, accelerating the conversion to glucose. Consequently, highly pulverized foods process much faster than their intact counterparts.
3. Thermal Application and Cooking Methods: The application of heat and water modifies the cellular structure of starches through a process known as gelatinization. Boiling a starchy food, such as pasta, for an extended period causes the starches to swell and break down, making them highly accessible to digestive enzymes. Conversely, cooking pasta "Al Dente" retains more of the structural integrity, resulting in a modified digestive timeline. Interestingly, the process of cooling certain gelatinized starches, such as cooked potatoes or rice, induces retrogradation. This process forms resistant starch, a structure that digestive enzymes cannot easily break down, thereby modifying the subsequent glycemic response.
4. Meal Composition and Food Combining: The consumption of carbohydrates in isolation presents a entirely different digestive scenario compared to consuming them alongside other macronutrients. The introduction of dietary fiber, complex proteins, or lipids into a meal triggers specific physiological responses, including the modification of gastric emptying. Gastric emptying refers to the rate at which the stomach releases its contents into the small intestine. By incorporating these additional components, the overall transit time of the meal is altered, which subsequently influences the absorption timeline of the carbohydrates. For more detailed observations on how meal composition relates to systemic function, you can explore the chronic inflammation nutrition guide.
5. Acidity and pH Levels: The introduction of acidic components, such as vinegar or lemon juice, to a meal alters the pH environment of the digestive tract. This environmental shift can temporarily modify the activity of specific carbohydrate-digesting enzymes, thereby altering the rate at which starches are broken down into simpler molecules.
6. Physical Form and Chewing: The mechanical effort required to consume a food influences its processing speed. Consuming an intact, whole apple requires significant mastication (chewing), which initiates a gradual digestive process. In contrast, consuming an apple that has been mechanically pulverized into a puree bypasses this initial mechanical breakdown, resulting in a different absorption timeline despite possessing the same fundamental ingredients.
Hypothetical Everyday Decision Scenarios
Translating mathematical formulas and scientific definitions into daily culinary decisions requires practical observation. Reviewing hypothetical scenarios assists in clarifying how these concepts apply to standard meal organization.
Scenario 1: The Melon Assessment. An individual observes a chart indicating that watermelon possesses a high GI value (often listed between 72 and 80). Based solely on this metric, the individual might consider eliminating the fruit. However, applying the Glycemic Load formula provides a different perspective. A standard one-cup serving of diced watermelon consists predominantly of water and fibrous tissue, containing approximately 11 grams of available carbohydrates. Applying the formula (76 x 11 / 100) results in a GL value of approximately 8.3, which falls firmly into the low category. Observation: The individual notes that the physical volume of the standard serving modifies the overall impact, allowing for the inclusion of the fruit within a structured framework.
Scenario 2: The Mid-Afternoon Snack Evaluation. An individual experiences satiety cues between scheduled meals and evaluates two options: a commercially puffed rice cake or a whole, intact apple. The rice cake presents a low physical weight and low caloric density, but its highly processed, aerated structure results in rapid enzymatic breakdown and a high GI value. The apple possesses a lower GI value due to its intact cellular structure and high fiber content. Observation: The individual selects the apple, noting that the mechanical effort of chewing and the presence of dietary fiber correspond with a more gradual digestive timeline and sustained satiety.
Scenario 3: The Pasta Preparation Strategy. An individual wishes to incorporate pasta into their evening meal without relying on a carbohydrate-exclusive plate. Rather than preparing a large, isolated portion of gelatinized noodles, the individual modifies the meal composition. The pasta portion is visually reduced by half, and the remaining space on the plate is populated with fibrous broccoli florets, grilled chicken pieces (protein), and a drizzle of olive
Frequently Asked Questions
What is the scope of this guide?
This guide is educational and helps readers organize questions and observations for further learning.
How should I use the information?
Use it to review terminology, note personal questions, and identify sources that require verification.
When should I seek professional guidance?
Discuss personal symptoms, medicines, diagnoses, or treatment decisions with a licensed professional.
Further Education
- Explore the metabolic health education hub
- Learn how to read research summaries
- Use the educational health assessment

Ready to choose a clearer health starting point?
Start with a short educational assessment to explore tools and resources that may fit your goal. It is not a medical diagnosis.
Continue learning at Insulin Resistance.